How to measure Net Promoter Score (NPS)
What Net Promoter Score is, how the number is worked out, and how to build a one-question NPS survey with a linear scale and score-based follow-ups.
Net Promoter Score (NPS) is a loyalty metric on a scale from -100 to +100. It comes from a single question, "How likely are you to recommend us to a friend or colleague?", answered from 0 to 10, and companies track it over time to see whether customers would send others their way.
This guide explains what the number means and how to build an NPS survey in Tinyform with a Linear scale question.
What is Net Promoter Score?
NPS reduces loyalty to one figure by asking one thing: on a scale of 0 to 10, how likely are you to recommend this company to someone you know. It was proposed in 2003 in a Harvard Business Review article, "The One Number You Need to Grow", and has since become a standard figure in board decks and quarterly reviews.
It is a loyalty measure rather than a satisfaction one. Satisfaction says how a single interaction went; NPS tries to predict whether a customer will stay, buy again and recommend you, which is what growth over years depends on.
How is NPS calculated?
Every 0 to 10 answer lands one respondent in one of three groups:
- Promoters (9 to 10): enthusiastic customers who are likely to recommend you.
- Passives (7 to 8): content but not committed. They are counted in the total but not in the score.
- Detractors (0 to 6): unhappy customers who may leave or warn others off.
The score is the share of Promoters minus the share of Detractors:
| Responses | Promoters | Passives | Detractors | NPS |
|---|---|---|---|---|
| 100 | 60 (60%) | 20 (20%) | 20 (20%) | 60 - 20 = 40 |
The result runs from -100, where everyone is a Detractor, to +100, where everyone is a Promoter, and is written as a whole number rather than a percentage.
How to build an NPS survey
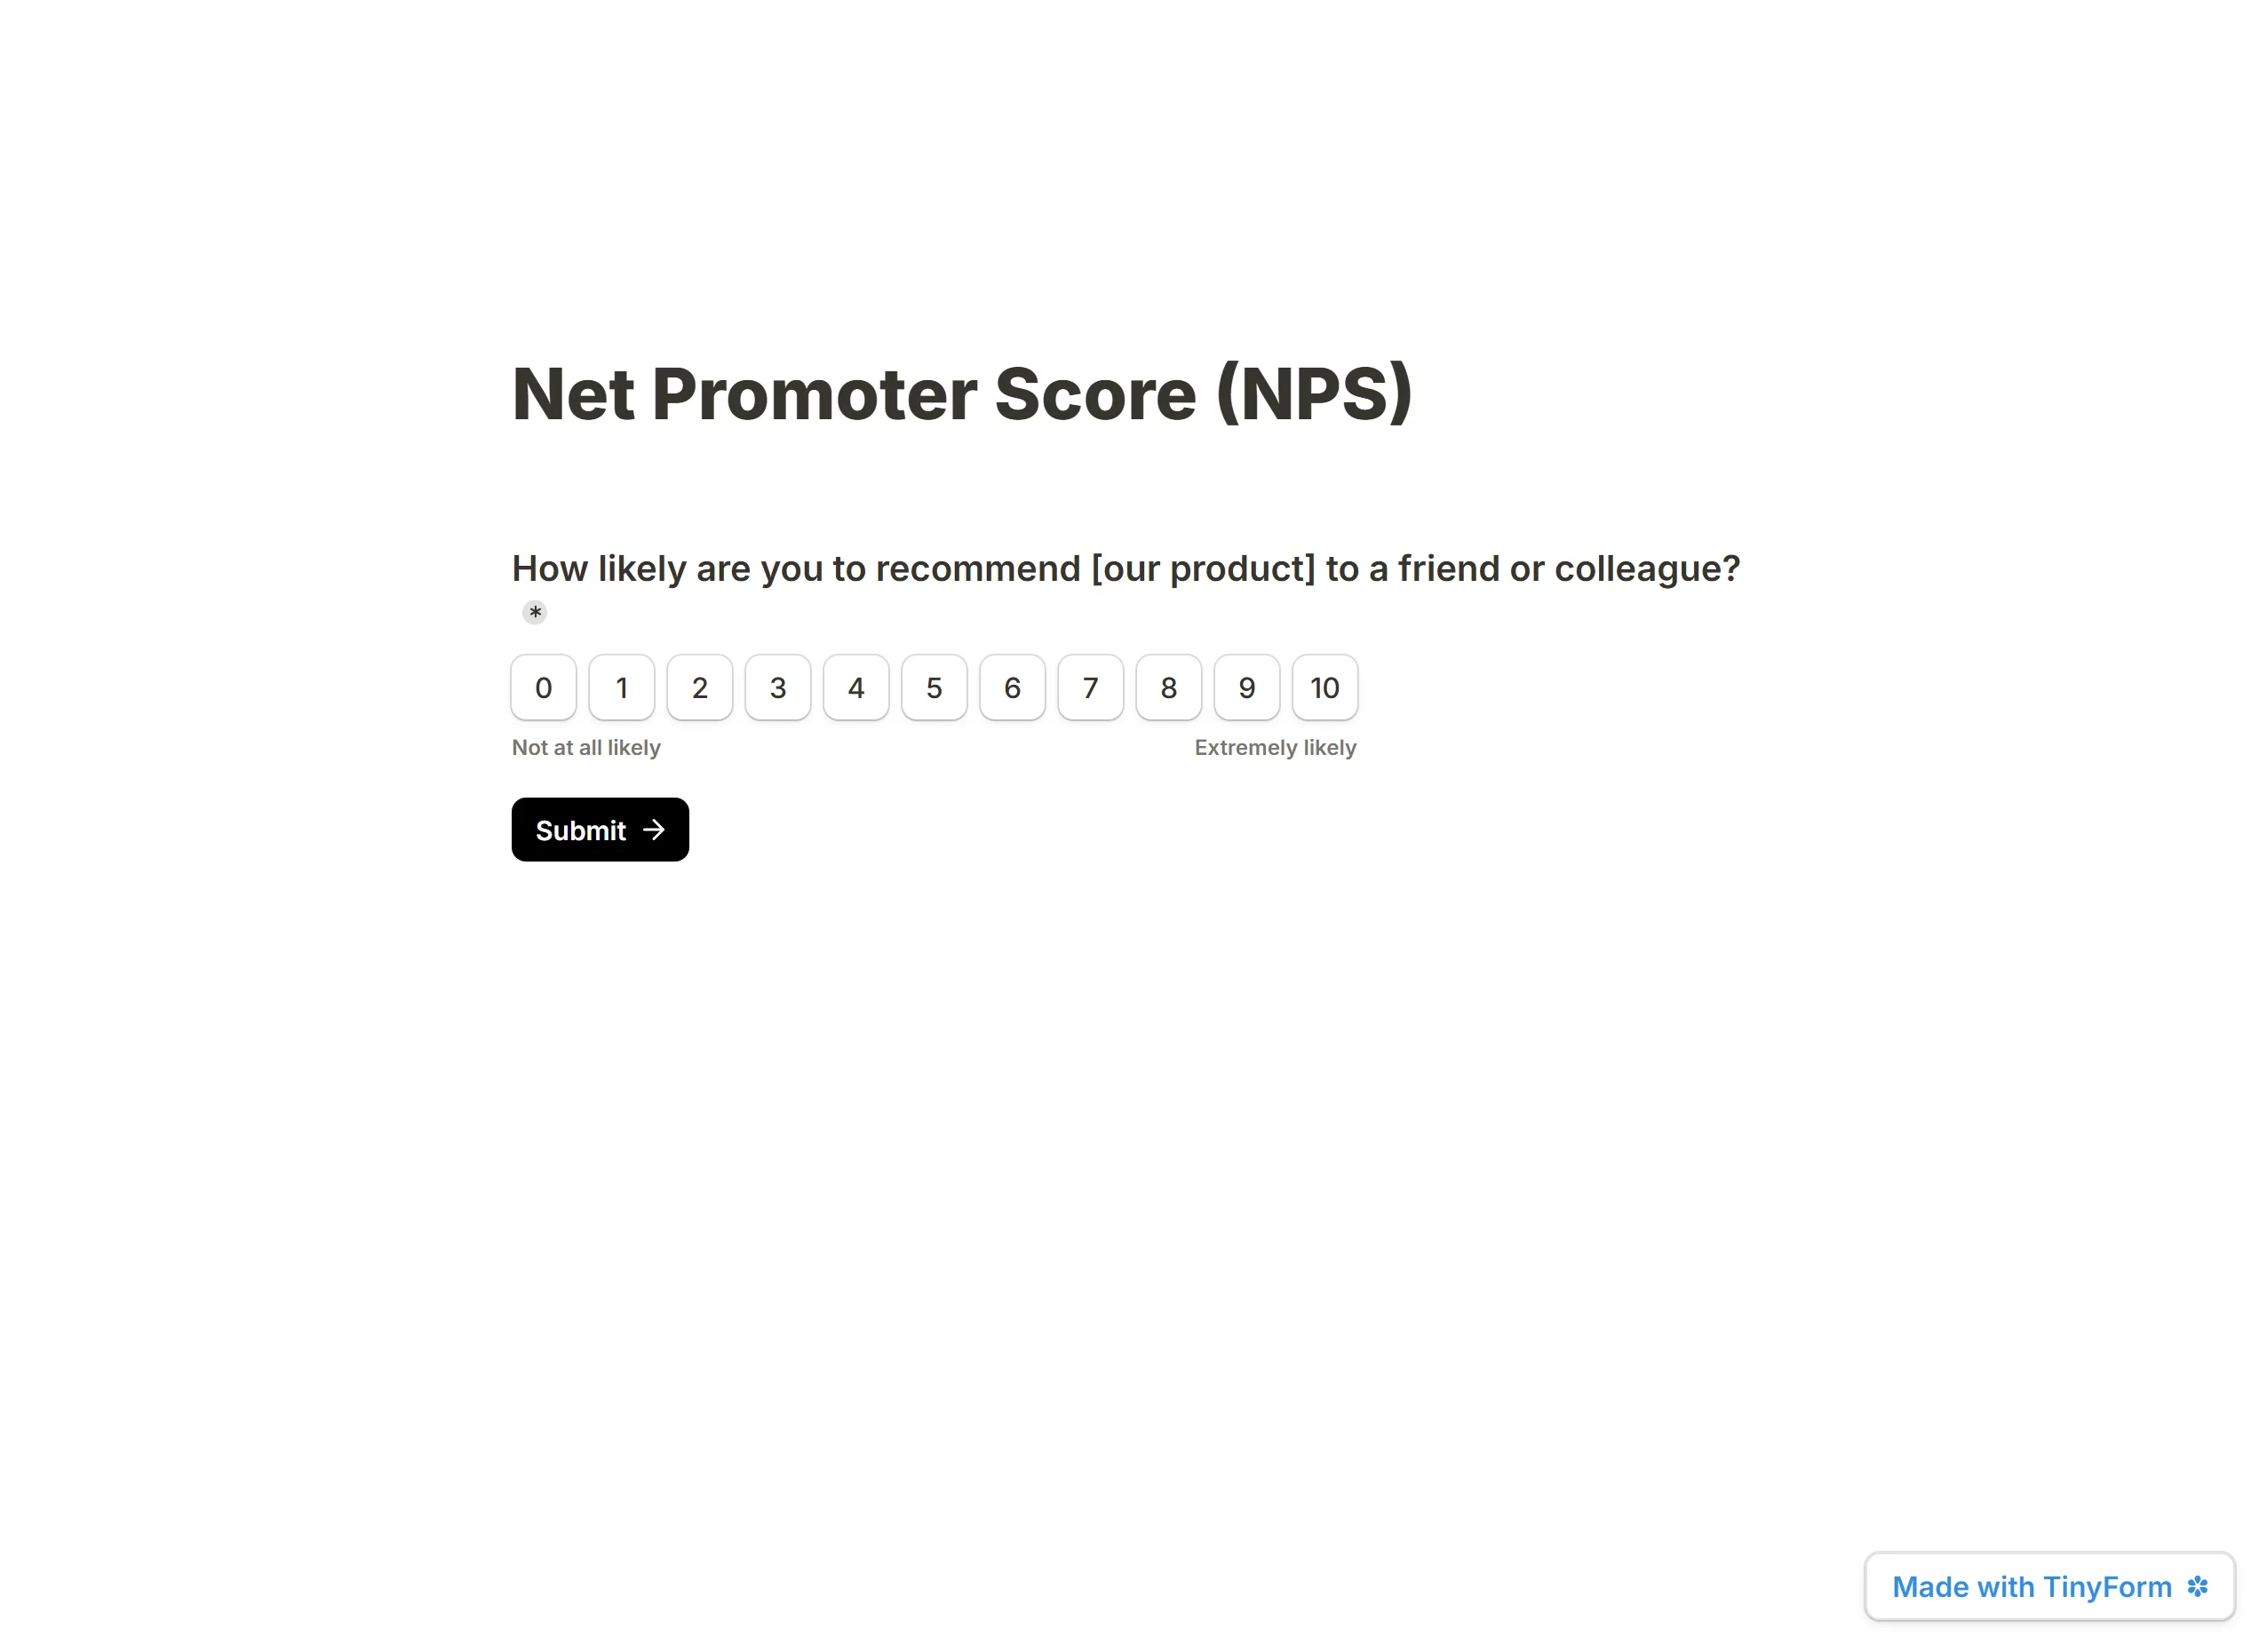
The standard wording is How likely are you to recommend [our product] to a friend or colleague? Keep it as it is; a changed question is no longer comparable with anyone else's score. Add one open follow-up shaped by the score and the survey is complete.
1. Add the NPS question
Create a form and insert a Linear scale question. Use the standard wording as its title. In the question's settings set Scale start to 0, Scale end to 10 and Scale step to 1, then write "Not at all likely" in Left label and "Extremely likely" in Right label. Center label can stay empty.
2. Add score-based follow-ups

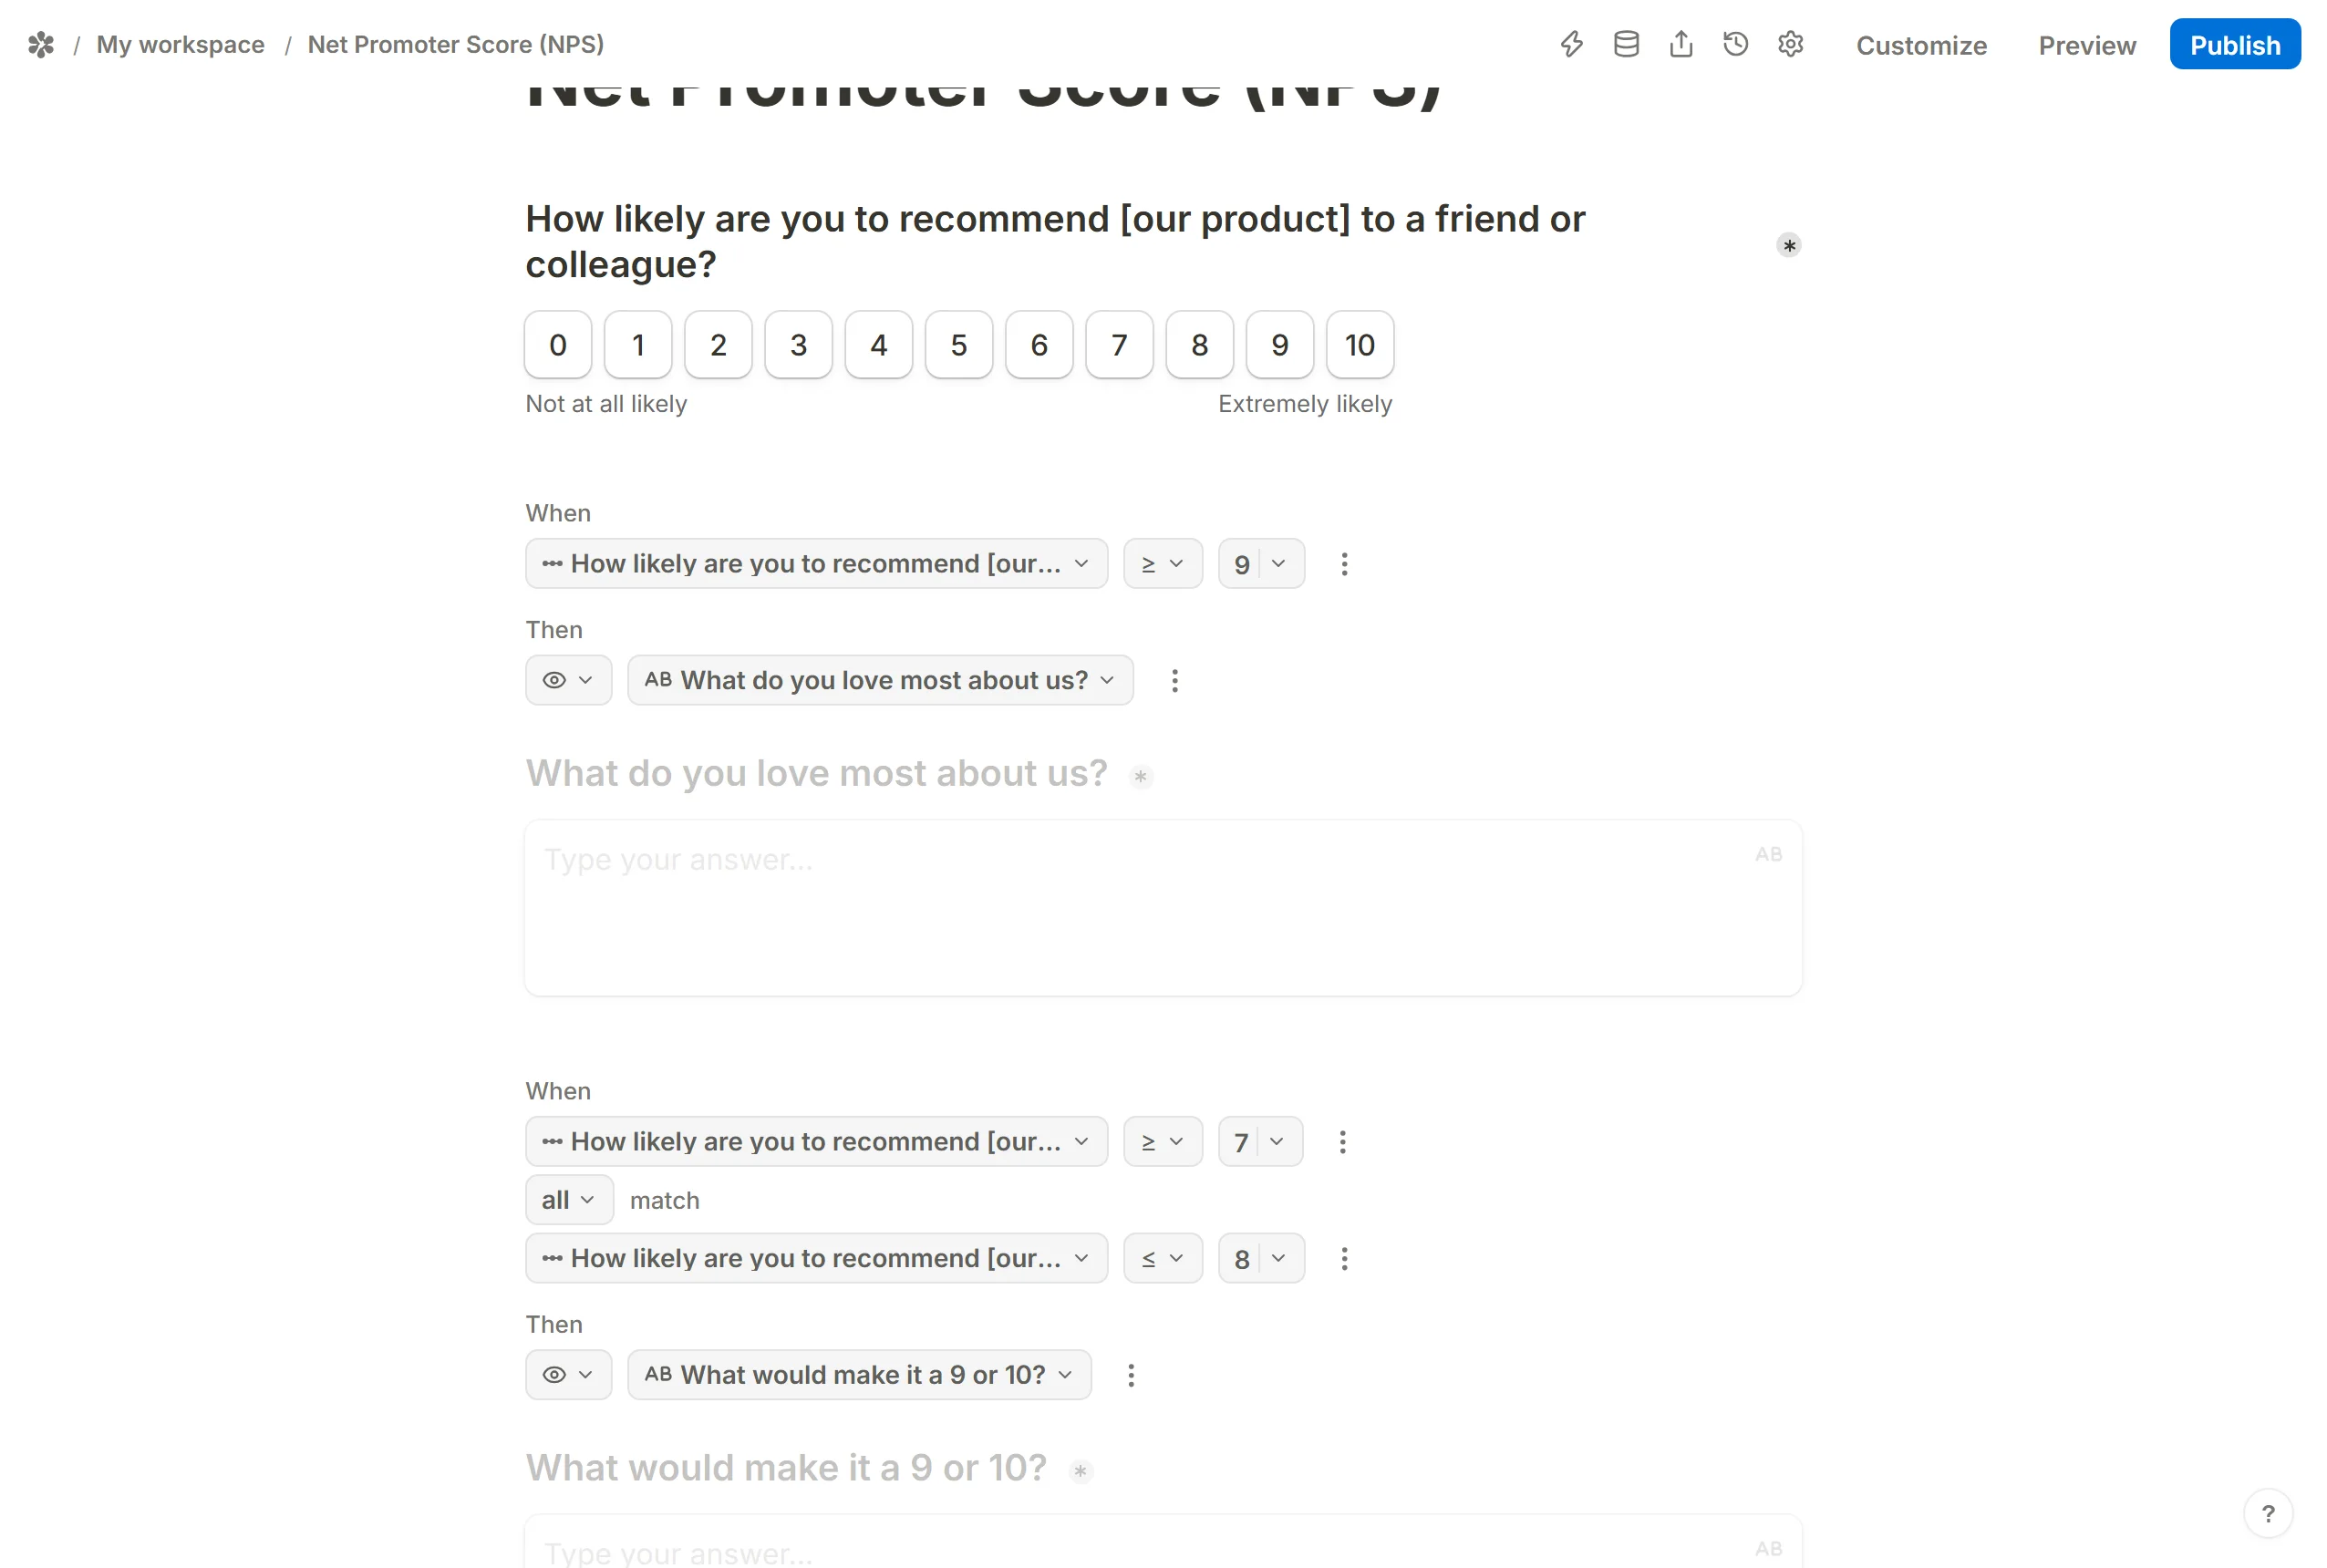
Add three Long answer questions, hide each with the block menu's Hide, and reveal one of them with conditional logic. A linear scale offers the numeric comparators, so one rule per group does it:
Whenthe scale≥9 →Show blocks→ "What do you love most about us?" for Promoters. Good material for testimonials.Whenthe scale≥7 and≤8 → the Passives' question, "What would make it a 9 or 10?". Add the second condition withAdd condition.Whenthe scale≤6 → "What could we do better?" for Detractors, usually the most useful feedback you will collect.
3. Share the survey
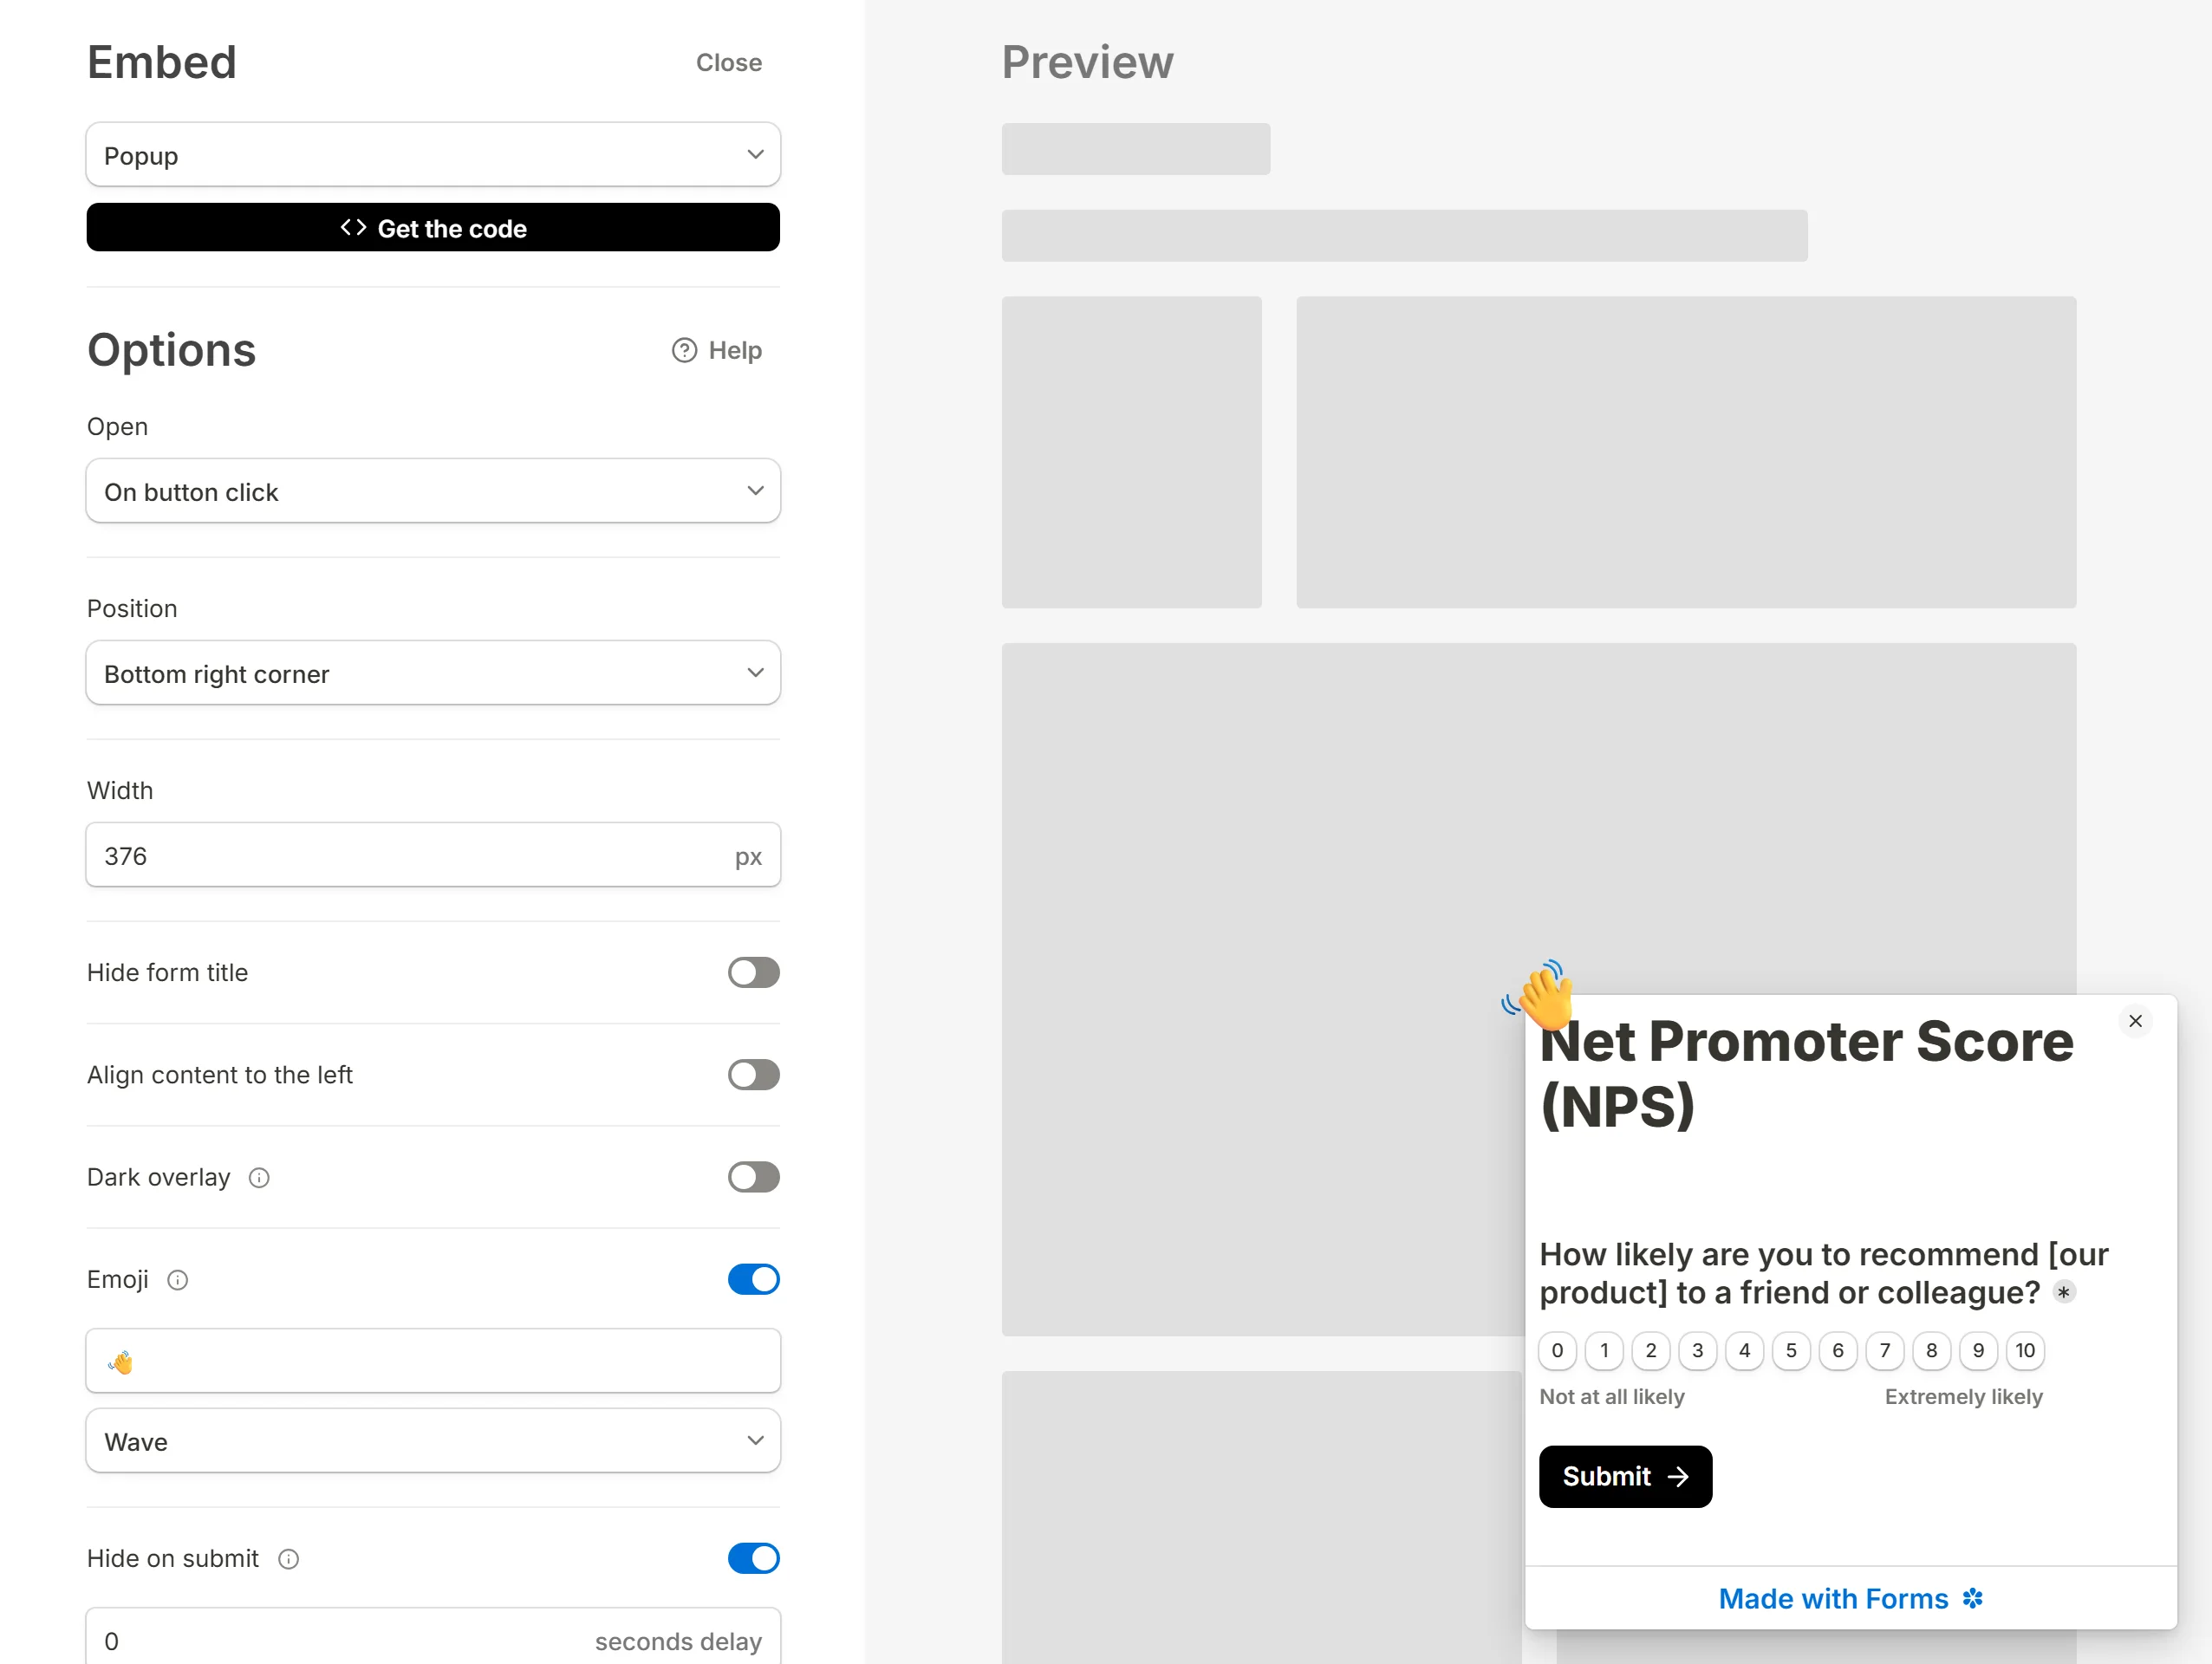
Send the published link, embed the form on a page, or open it as a popup inside your product. A popup right after a purchase, an onboarding step or a support conversation catches the opinion while it is fresh.
With one question on the first page, turn on Settings → Behavior → Auto-jump to next page; a tap on a number moves the respondent on without a Next button.
4. Read the results
The Insights tab's Answers view draws a card for the scale question with three views to pick from: CSAT, Average and Median. Average and Median tell you where the answers sit, and the CSAT ring splits them into satisfied, neutral and dissatisfied bands scaled to the top mark.
Tinyform does not compute the NPS figure itself. To get it, download the CSV from the Submissions tab, count the answers of 9 or more and of 6 or less, divide each by the total, and subtract. A spreadsheet with three COUNTIF cells does it in a minute. See Form insights for what the tab does draw.
5. Send it onwards
Once responses arrive, email notifications can tell you about each one, with the score mentioned in the subject line, and webhooks can hand every response to whatever tool your team already works in.
What is a good NPS score?
A score above 0 means Promoters outnumber Detractors. Above 20 is generally read as good, above 50 as excellent, and above 70 is rare and reached by only a few brands.
The comparison that matters is with your own sector, not the whole economy: consumer software and online shops tend to sit far higher than insurers, telecoms or payment providers, so a 40 is a fine result in one industry and below par in another. The comparison that matters more still is with your own score a quarter ago.
Frequently asked questions
What is the difference between NPS, CSAT and CES?
They measure different moments. NPS asks about long-term loyalty on a 0 to 10 scale. CSAT asks how satisfied someone was with one interaction, usually on a 1 to 5 scale. CES, the Customer Effort Score, asks how easy a specific task was.
How often should you send an NPS survey?
A relationship survey every three to six months captures overall sentiment. A transactional one, sent within a day or two of a purchase, an onboarding step or a support ticket, captures the reaction to that event.
What is a good follow-up question?
"What is the main reason for your score?" works for everyone. Branching by group gives sharper answers: Promoters get "What do you love most?", Passives "What would make it a 9 or 10?", Detractors "What could we improve?". A Promoter who has just said they would recommend you is also the right person to ask for a public review; Redirect on completion can send them to your review page.
Does Tinyform calculate NPS automatically?
No. The Insights tab shows the average, the median and a satisfaction split for a linear scale, but the -100 to +100 figure has to be worked out from the exported answers as described above.