Form Insights
Read your form in aggregate: charts per question, visits and where they came from, and the funnel that shows which question people leave at.
The Insights tab is where a form is read as a whole rather than one submission at a time. It answers three questions on three tabs: what did people answer, who came to the form and from where, and where did they give up. It is the form's home page too: /forms/<id> opens it, at /forms/<id>/insights.
- Every question drawn as a chart, with a satisfaction score, an average or a median for the numeric ones
- Visits, submissions, unique respondents and how long a visit lasts
- Traffic by source, device, country, city, browser and operating system
- A per-question drop-off funnel
Nothing on this tab is restricted, and every date range is available on every form.
Answer insights
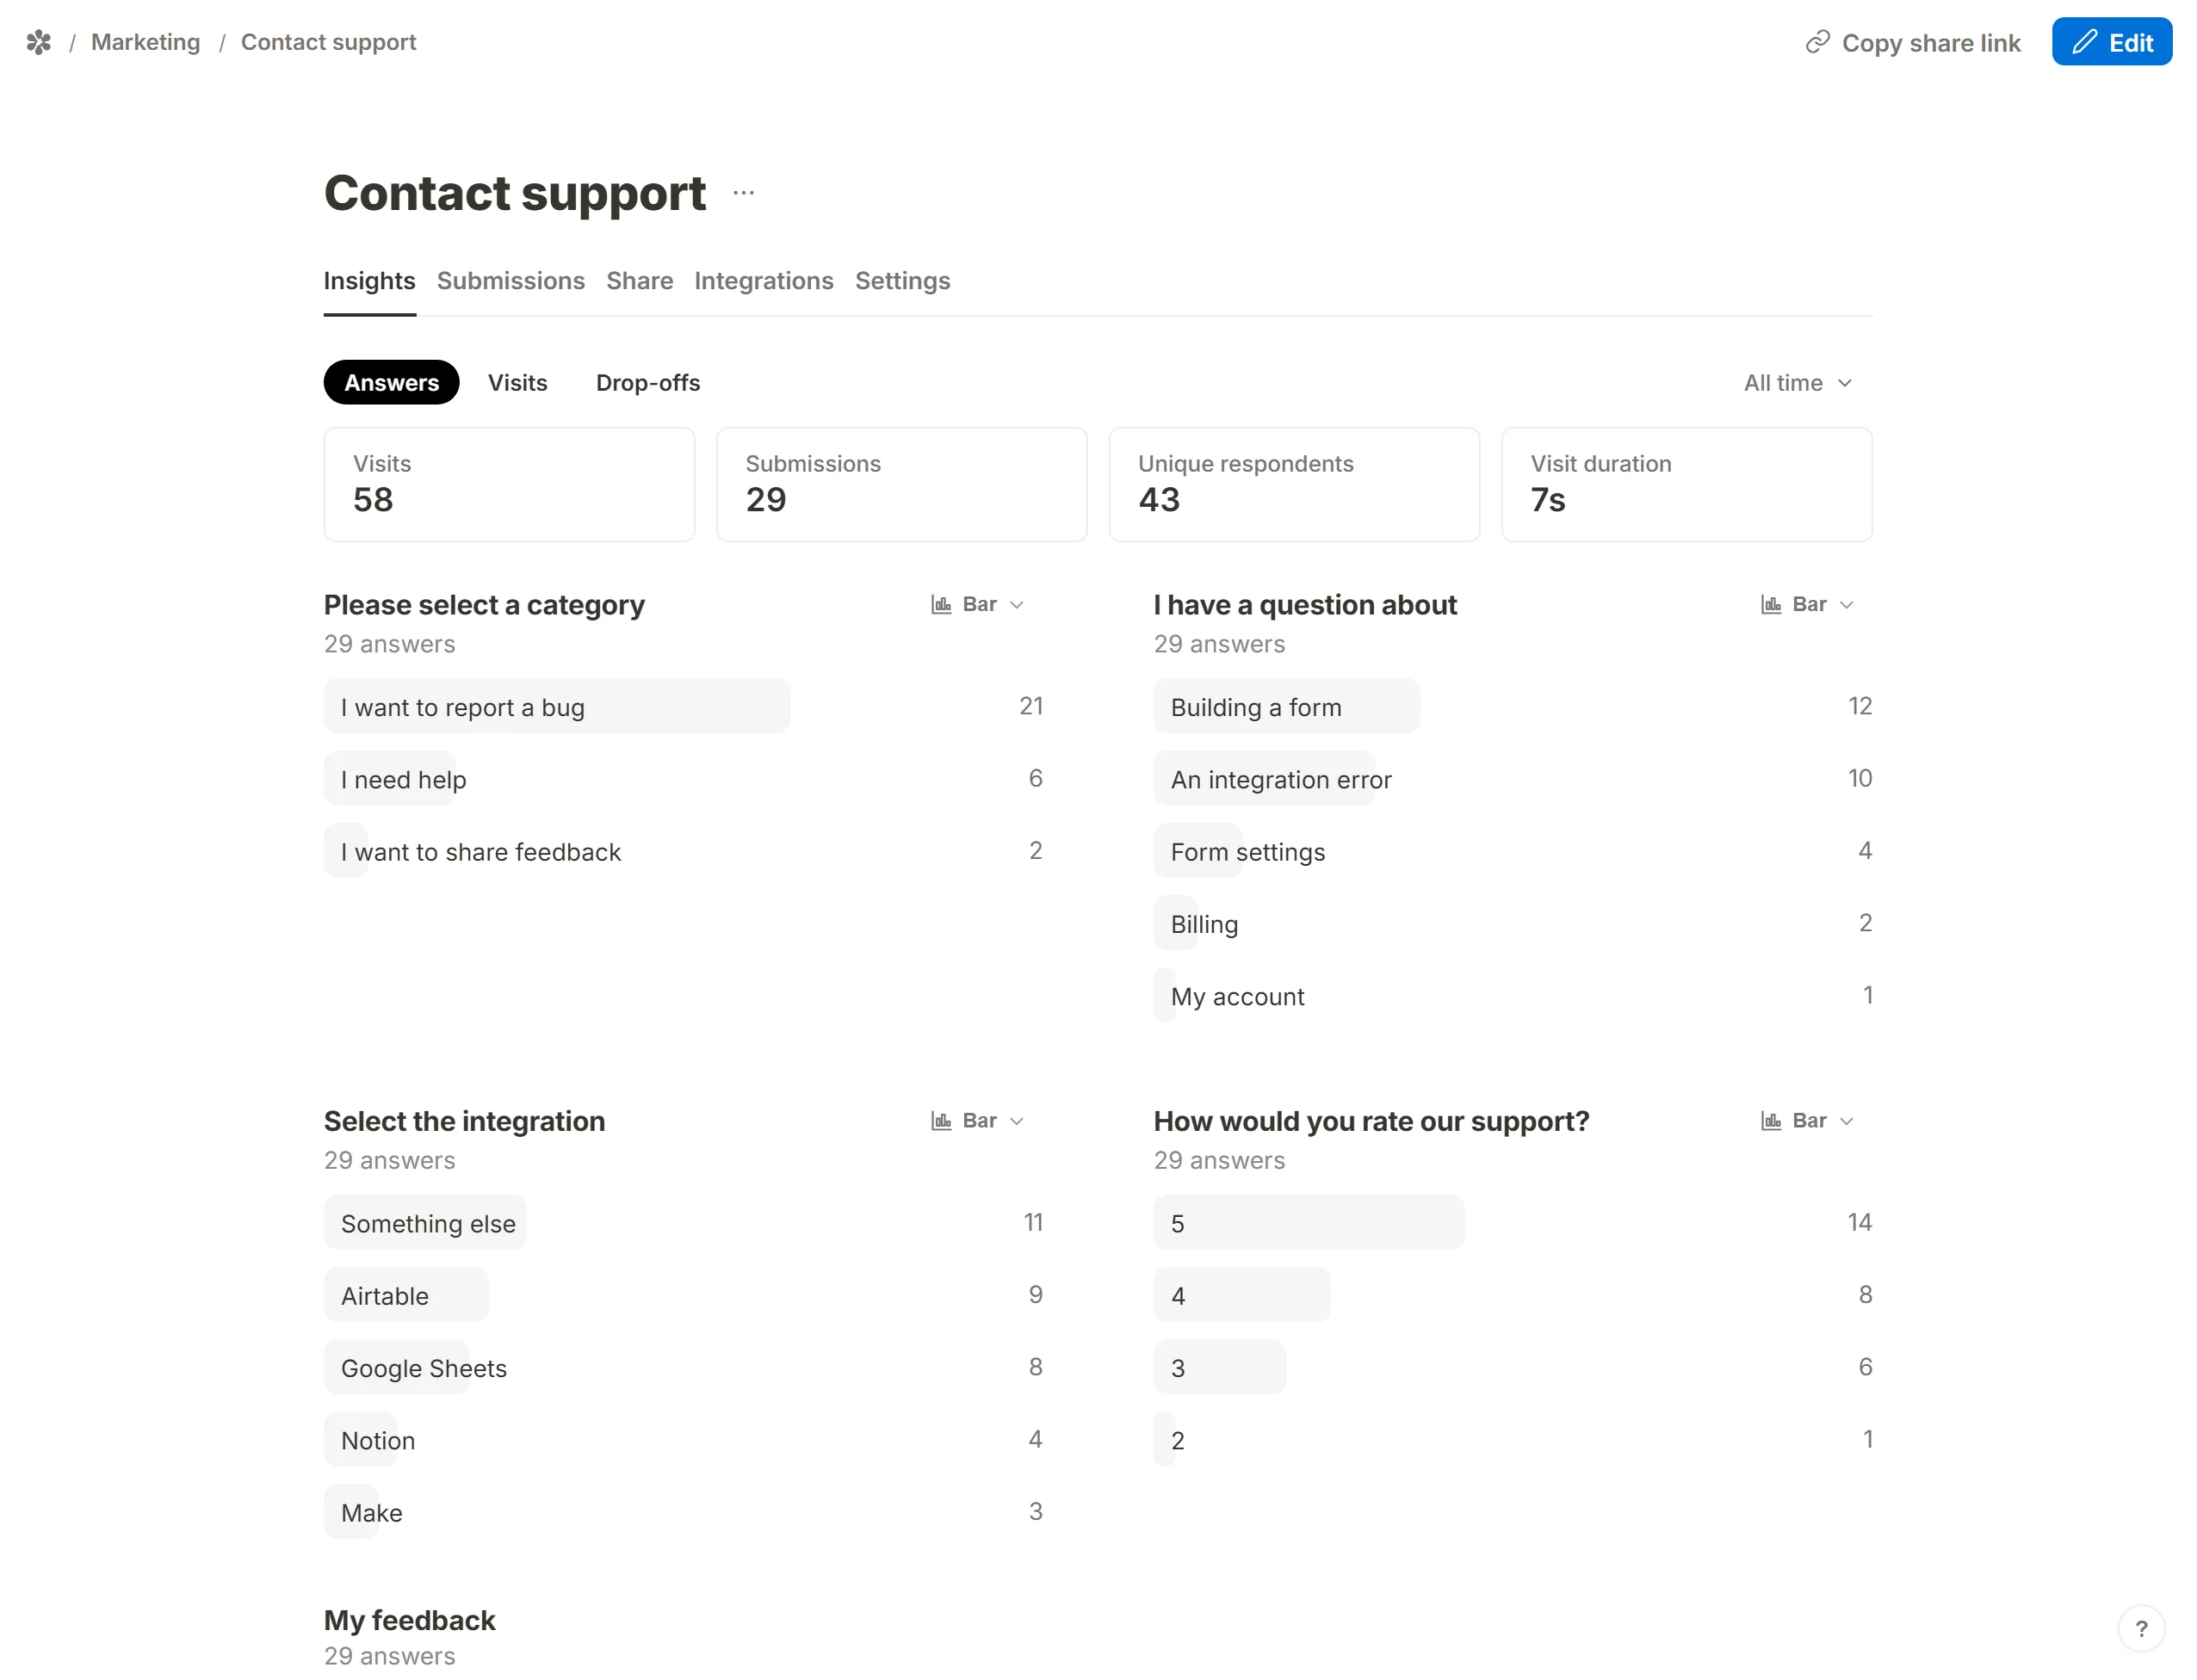
The Answers tab, the default, tallies the completed submissions. Each question has a card. A choice question (multiple choice, checkboxes, dropdown, multi-select) draws a bar per option, and a control on the card switches it to a pie. A rating, linear scale or number question adds three more views: CSAT, the satisfaction split over the answers, Average and Median. Whichever view you pick is remembered for that question in your browser, so the layout you set up is the one you come back to.
A ranking question shows the aggregate order, with the average rank and the spread of positions for each option. Matrix questions are broken out per row. Calculated fields and hidden fields are listed as name = value under their own headings rather than charted.

The count is over the newest 500 completed submissions in the chosen range, and the Submissions tile on this tab counts the completed rows that still exist, so deleting a test response removes it from the charts at once. This tab reads the same database the Submissions table does; it is the truth about your answers even if the analytics store behind the other two tabs is unavailable.
Visit insights
The Visits tab shows how many people reached the form and where they came from.
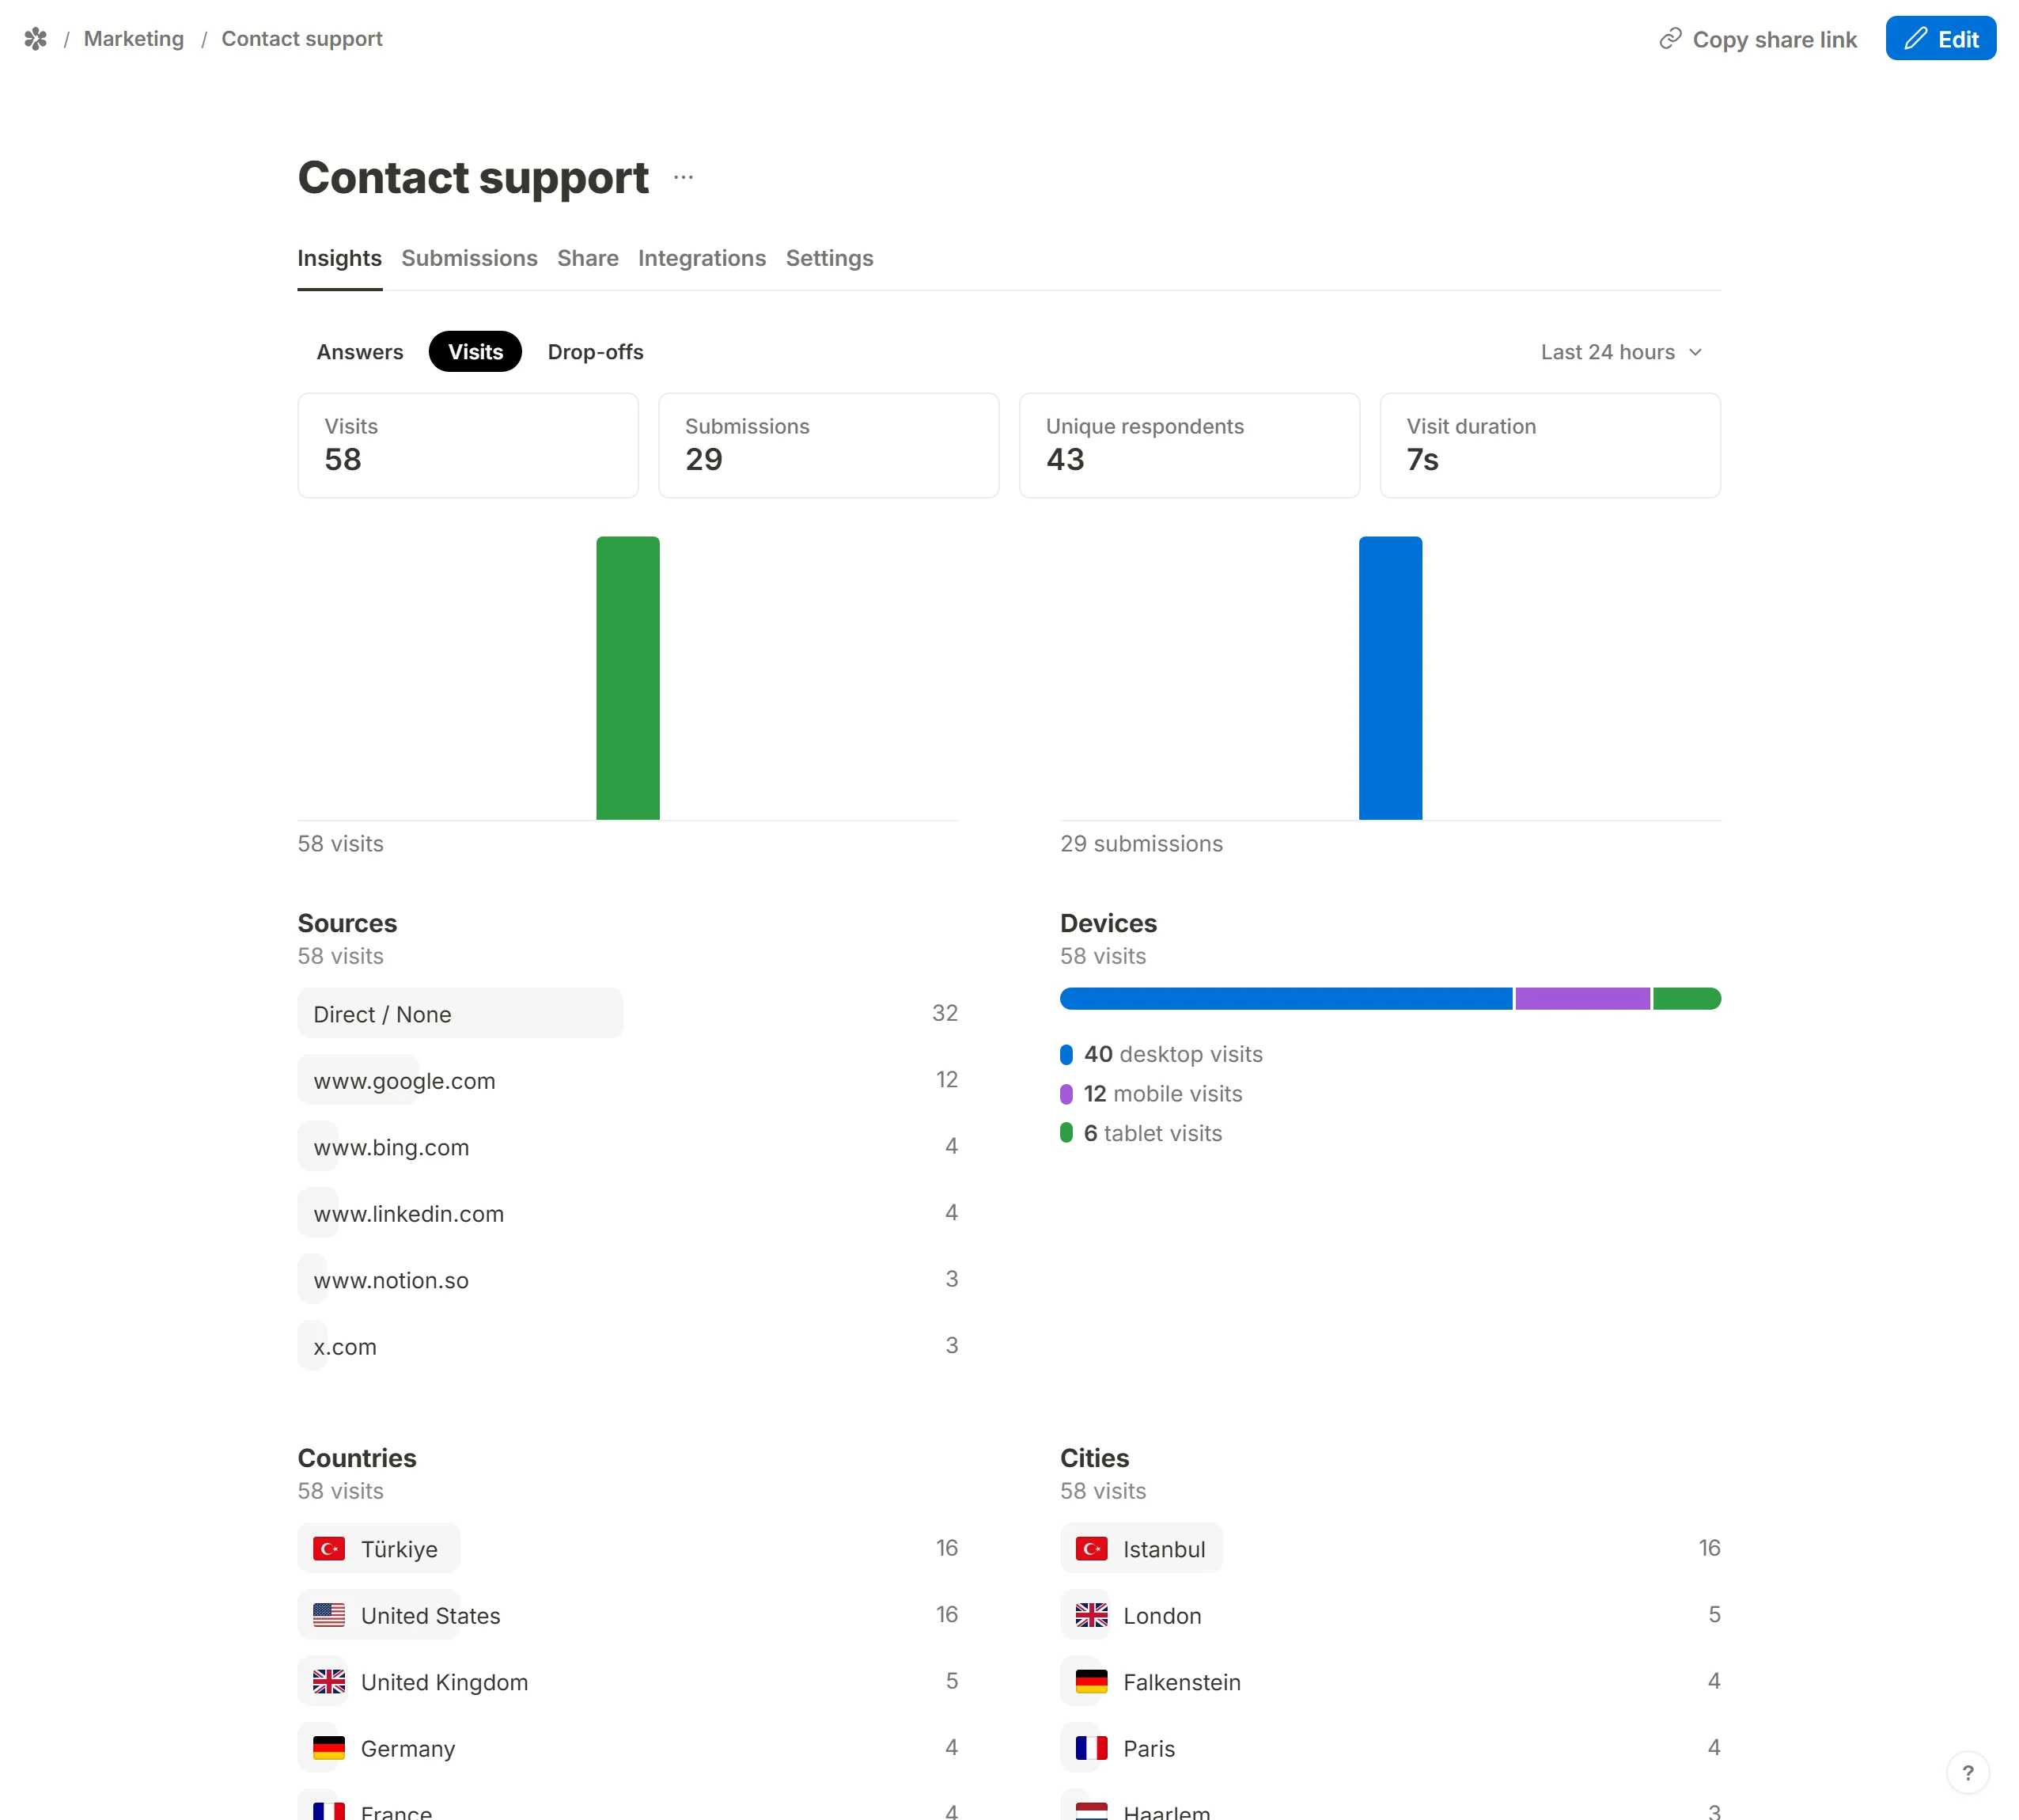
Four tiles at the top:
- Visits: how many times the form was opened.
- Submissions: how many completed responses were recorded in the range.
- Unique respondents: how many distinct people submitted.
- Visit duration: the typical time spent on the form, whether or not it was submitted.
Under them, a chart of visits and completed submissions over time. For Today, Yesterday and Last 24 hours it draws a bar per hour; for anything longer, a bar per day.
Then six breakdowns, each showing the top entries with the rest grouped as Other and a See all button that opens the full list:
- Sources: where visitors came from.
- Devices: desktop, mobile or tablet.
- Countries and Cities: read from the visitor's network, so a city is sometimes missing where the country is not.
- Browsers and Operating systems.
Date ranges
The range picker at the top right offers Today, Yesterday, Last 24 hours, Last 7 days, Last 30 days, Last 3 months, Last 6 months, Last 12 months and All time. Answers opens on all time; Visits and Drop-offs open on the last 24 hours. The choice travels in the URL as ?range=, so a link to a range can be shared with a colleague.
Drop-off insights
The Drop-offs tab (?tab=question-drop-off) shows where people leave, as a funnel from the first visit to the last submission.
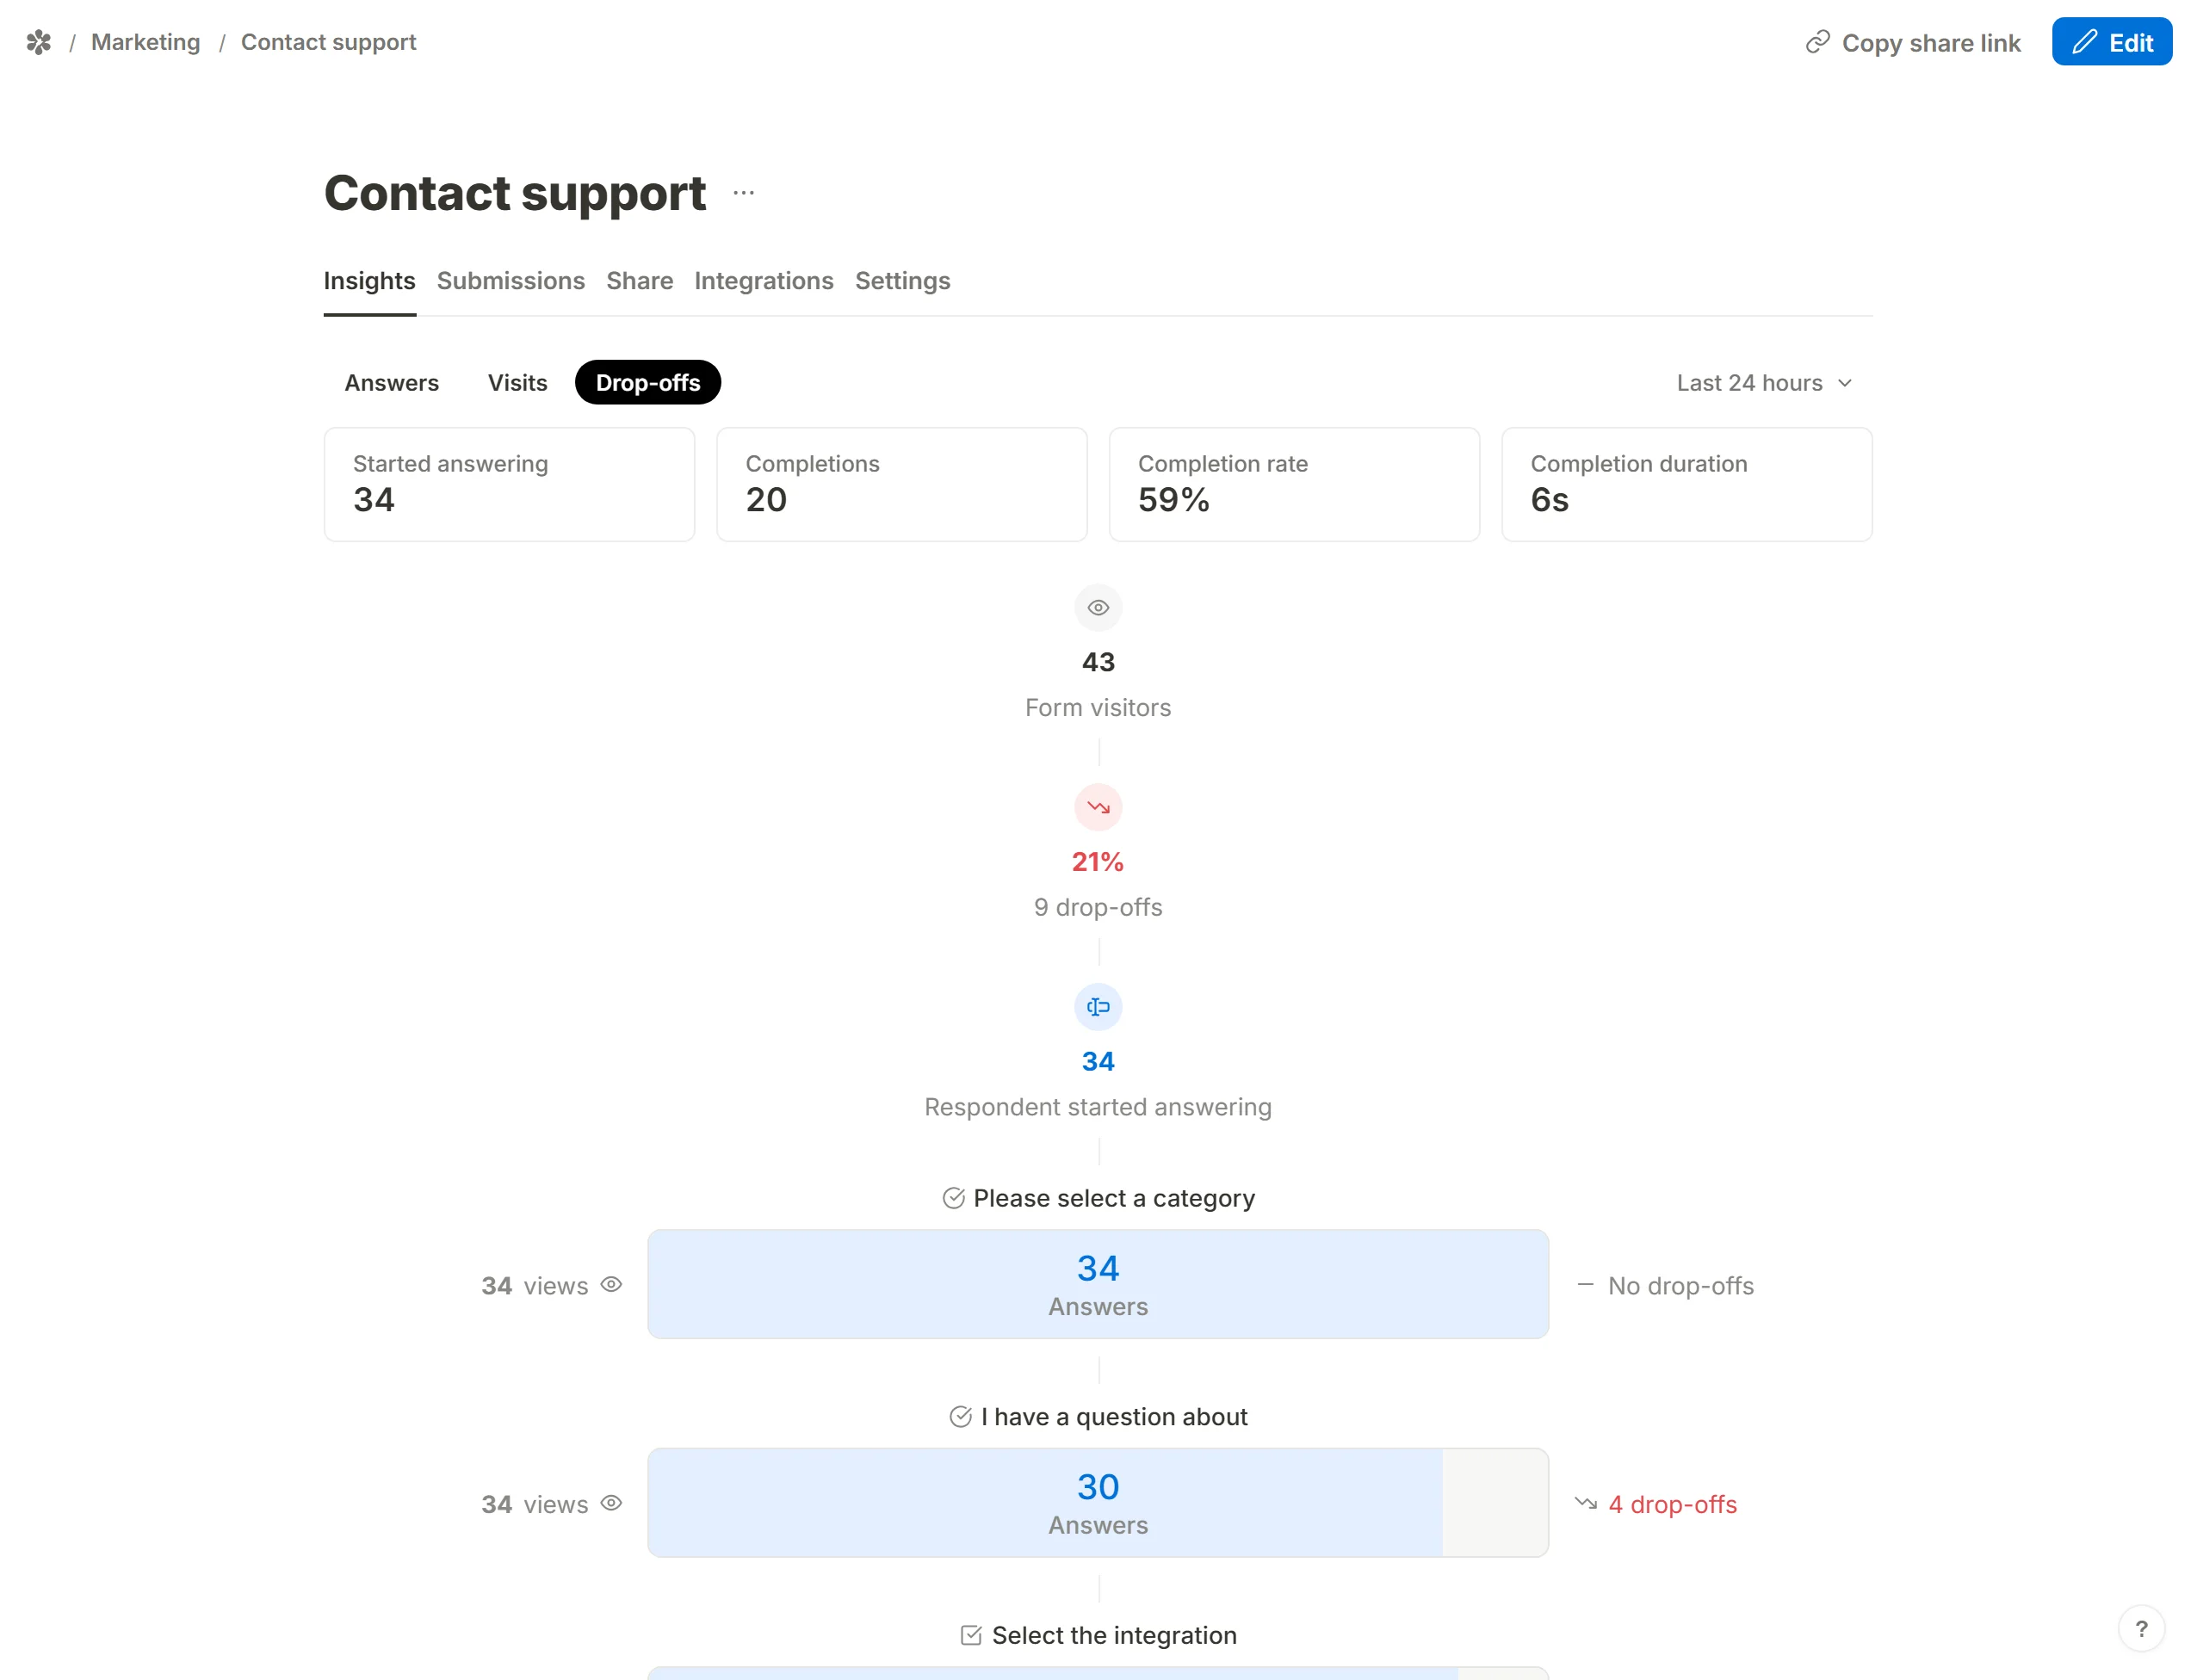
Reading from the top:
- Form visitors: everyone who opened the form.
- Drop-offs before starting: the share who left without answering anything.
- Respondent started answering: visitors who touched at least one question.
- One row per question, with its views (how many respondents reached it), its answers, and its drop-offs (how many left the form with that as the last question they were on), the bar between them showing answers as a share of views.
- Respondents completed the form and the Completion percentage.
Hidden fields, calculated fields and the respondent's country block are not in the funnel: a visitor cannot answer them, so a row for one would only ever read as a drop-off.
Tips for reducing drop-off
A step where many people leave usually means confusion, effort or irrelevance. If one question stands out:
Make it easier to answer
- Shorten or rephrase a long question.
- Vary the question types so a run of open text becomes a mix of choices and text.
- Make fewer questions required.
Keep it relevant
- Use conditional logic to show a question only to the people it applies to.
- Move sensitive or optional questions toward the end.
- Split a long form into several pages.
Improve the experience
- Turn on the progress bar so respondents can see how far they are.
- Write the questions the way you would ask them in person.
- Give the form a look of its own.
- Pre-fill what you already know with hidden fields and answer piping.
Frequently asked questions
Which question types get a chart?
Multiple choice, checkboxes, dropdown, multi-select, matrix, rating and linear scale. Number questions get the average and median views. Ranking shows an aggregated order instead of a chart.
Are NPS and CSAT calculated automatically?
CSAT is one of the views on a rating or scale card. NPS is not computed for you; the NPS guide explains how to read it off a 0 to 10 scale.
Is any part of Insights paid?
No. All three tabs and every date range are included on every form.
How far back can I see data?
As far back as the form has data. Answers are read from the submissions themselves, and visits and drop-offs from the events recorded since the form was published.
Can I exclude test submissions?
Delete them from the Submissions tab. The Answers tab counts only the rows that still exist, so the charts update on the next load. Visit and drop-off counts are footsteps recorded at the time and do not change when a submission is deleted.
Can I share or export the Insights tab?
Not as a page: Insights is visible to the members of the form's workspace. To share results, take a screenshot, export the submissions as CSV, or use the PDF export for individual responses.
How do I search or filter submissions?
The Submissions table has no search box. Use your browser's find on the page, or download the CSV and filter in a spreadsheet.
Is this tracking privacy-friendly?
The data lives on your own install and leaves it for nowhere. Visit events are aggregated, the visitor's network address is hashed with a salt rather than stored, and no third-party analytics script is loaded on the published form.